Why are data visualisations recommended for your websites and apps
13 | November 03, 2021
Be it a website or an app, one of the primary objectives is to provide an overall idea regarding your business in a simple manner. Data visualization is an attractive way to grab the attention of your users and demand them to read more about your company. These help you to represent wide amounts of data in a simple manner. We are a creative digital branding agency in Kerala that helps you plan, develop and perfect websites in a way that suits your business aesthetics. Users now have multiple options and the only way to grab their time and attention is by providing them with something new.
Including visual elements such as graphs, charts and other visual representations will help you to make your product a bit more attention-grabbing, neat and expressive. These will help you garner more audience, user engagement and conversions.
So why do we recommend data visualisations for your websites and apps?
Helps you to present yourself in a better manner
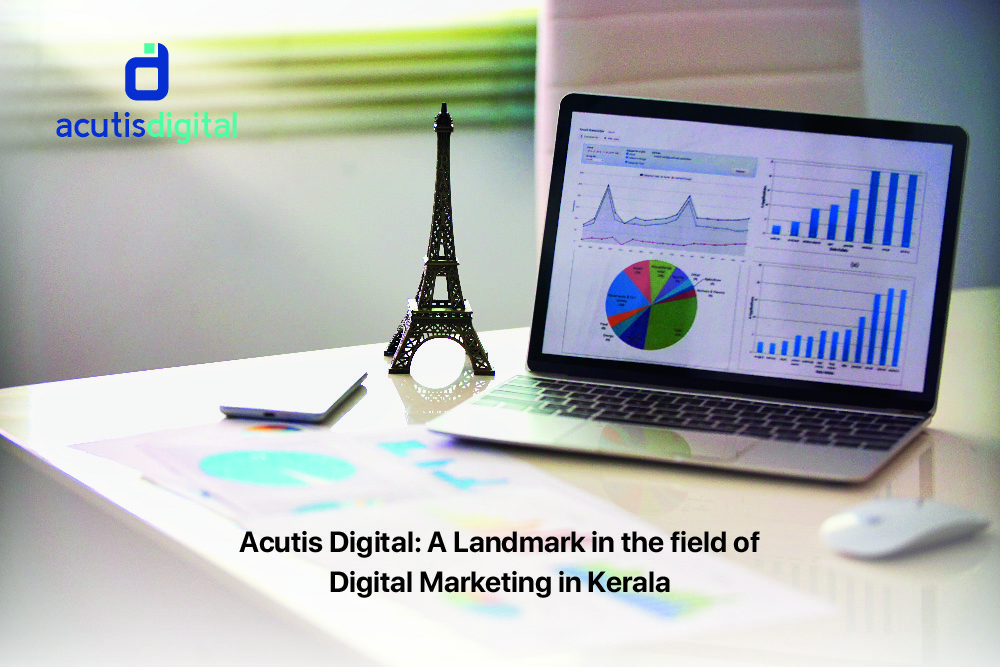
Data visualisations play a key role in presenting what your business has to say to your prospective customers in a better manner. It helps you to condense pages of information into a neatly packed and colourful one. Users will be able to read and interact with your content easily
It gives the content better readability
Visualisations are a way to simplify content. It ensures that users are able to read and comprehend the data provided in your website or app. The more people read and understand the more are the chances of conversion.
Keeps your website contents short, minimal and to the point
Users have a very short span of attention and they need things fast. No one is going to read a lot of pages of information. Keep your websites and apps short and colourful.
Better user engagement and conversions
The better the visualisations, the greater are the chances of your visitor choosing your product or service. So act smartly and design your website in such a way that it urges your visitors to buy your product/service. So if you need a web development company in Kerala that lets you design efficient and creative websites – contact us today.
What are the different types of visualisations that you can use in your websites??
Choosing the right type of visualisation is important. It lays the foundation and tone of your website. Each type of visualisation serves different kinds of purposes. At some places pie charts might work greater than bar graphs – It’s all in choosing the one that serves you best! Some of the commonly used types of data visualisations you can use in your website are; bar graphs, pie charts, line graphs, sparklines, bubble charts, maps and more.
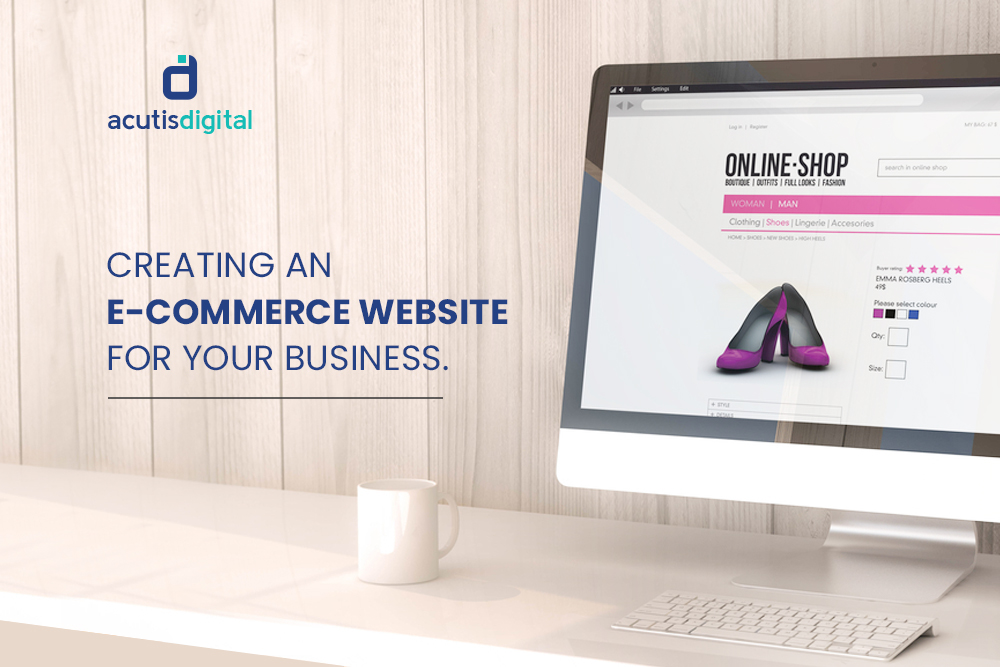
Your business website or app needs to serve your prospective customers in the right manner. Everything must be placed in the right manner. Users must be able to navigate through your website and locate things and information easily. The same is the case when you design and develop your e-commerce website. Visualisations can be used to present your past data in an effective manner. To get your e-kart done by the most trusted ecommerce development company in Kochi, reach out to our web experts at Acutis Digital.


.jpg)
